
Featured image: Abstract visualization of neural networks and AI data processing. Photo by Novoto Studio on Pexels (Free to use).
Wall Street has placed a historic bet on artificial intelligence. The Magnificent Seven alone account for more than a third of the S&P 500. Total US corporate stock is worth $80 trillion — over 2.5 times annual GDP. Goldman Sachs projects $7.6 trillion in AI infrastructure spending by 2031. And the Center for Economic and Policy Research now runs a weekly AI Bubble Monitor, tracking a market it says is “arguably even larger relative to the economy than the tech bubble when it peaked in 2000.”
These are not fringe warnings. Mainstream voices from Capital Economics, Oliver Wyman, and Dean Baker all agree on the same thesis: the AI-driven equity rally is approaching its final stages, and the correction that follows could be historically severe. Below, we walk through the evidence, compare the current environment to past bubbles, and lay out what investors and professionals should consider before the cycle turns.
What Evidence Suggests an AI Bubble Has Formed?
The case for an AI bubble rests on four interconnected indicators: extreme market concentration, valuation multiples that exceed historical norms, a capital expenditure trajectory disconnected from revenue, and surging debt issuance to fund the build-out.
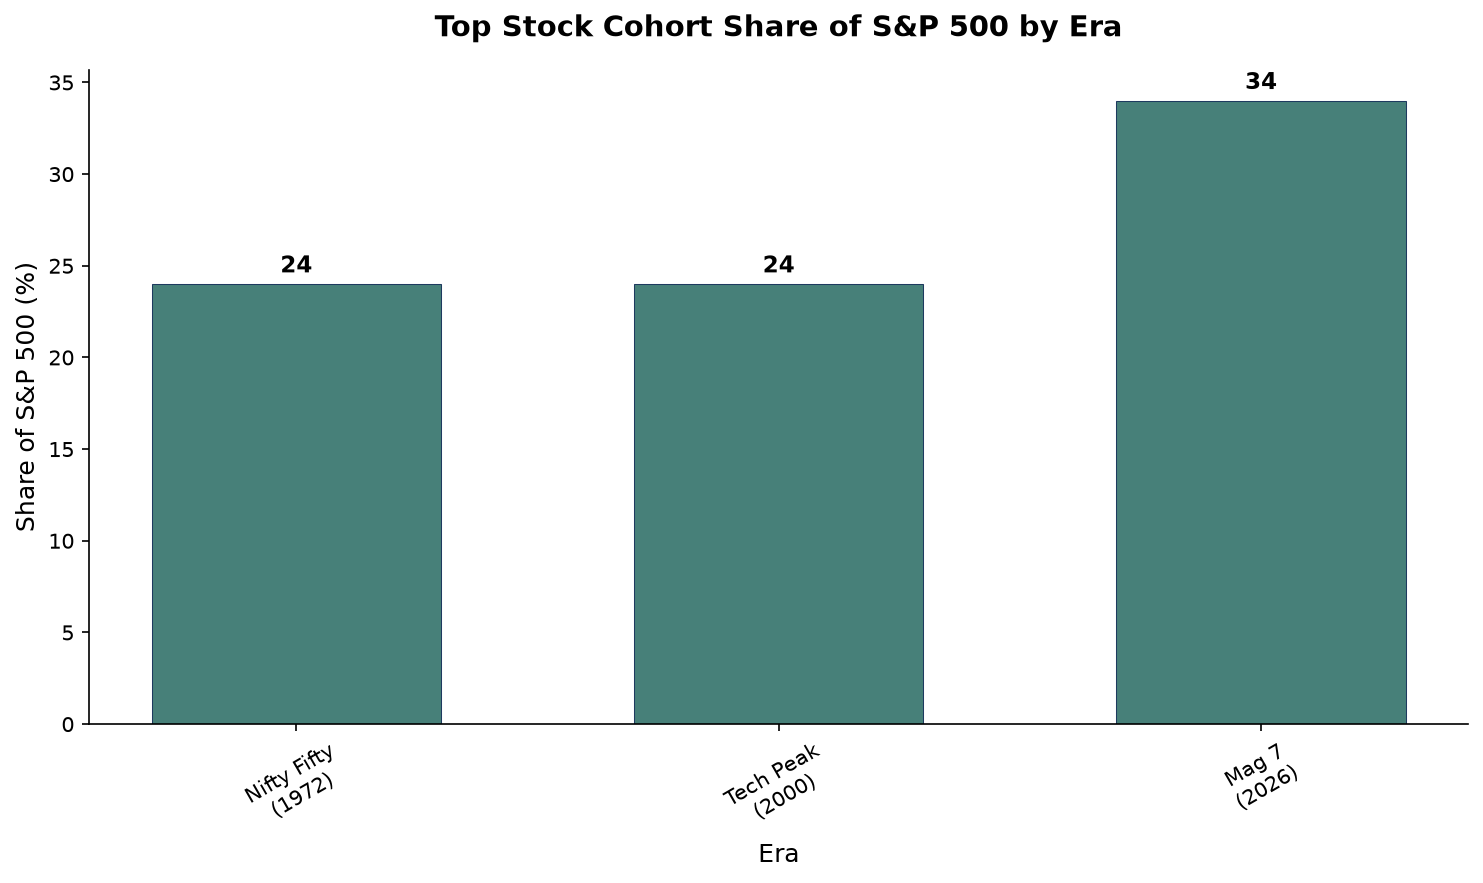
Market concentration alone tells a stark story. The Magnificent Seven — Apple, Microsoft, Alphabet, Amazon, Nvidia, Meta, and Tesla — now represent roughly 34% of the S&P 500 by market capitalization. Ferrante Capital notes this is “the highest index-level concentration of a small cohort of names in the modern history of the index,” exceeding both the Nifty Fifty peak of 24% in 1972 and the tech peak of 22-24% in 2000. The combined market cap of these seven companies exceeds $22 trillion, according to data from Stock Analysis cited by the Motley Fool.
Valuation multiples paint an equally concerning picture. Robert Shiller’s cyclically adjusted price-to-earnings (CAPE) ratio stands at 39.6, slightly below the 2000 peak but still more than double the long-term average of roughly 20. Dean Baker, senior economist at CEPR, points out a crucial difference from 2000: after-tax corporate profits are nearly twice as large a share of GDP today as they were at the dot-com peak. “That means that the value of the stock market relative to the economy is nearly twice as large as it was at the peak of the tech bubble,” Baker writes in the AI Bubble Monitor.
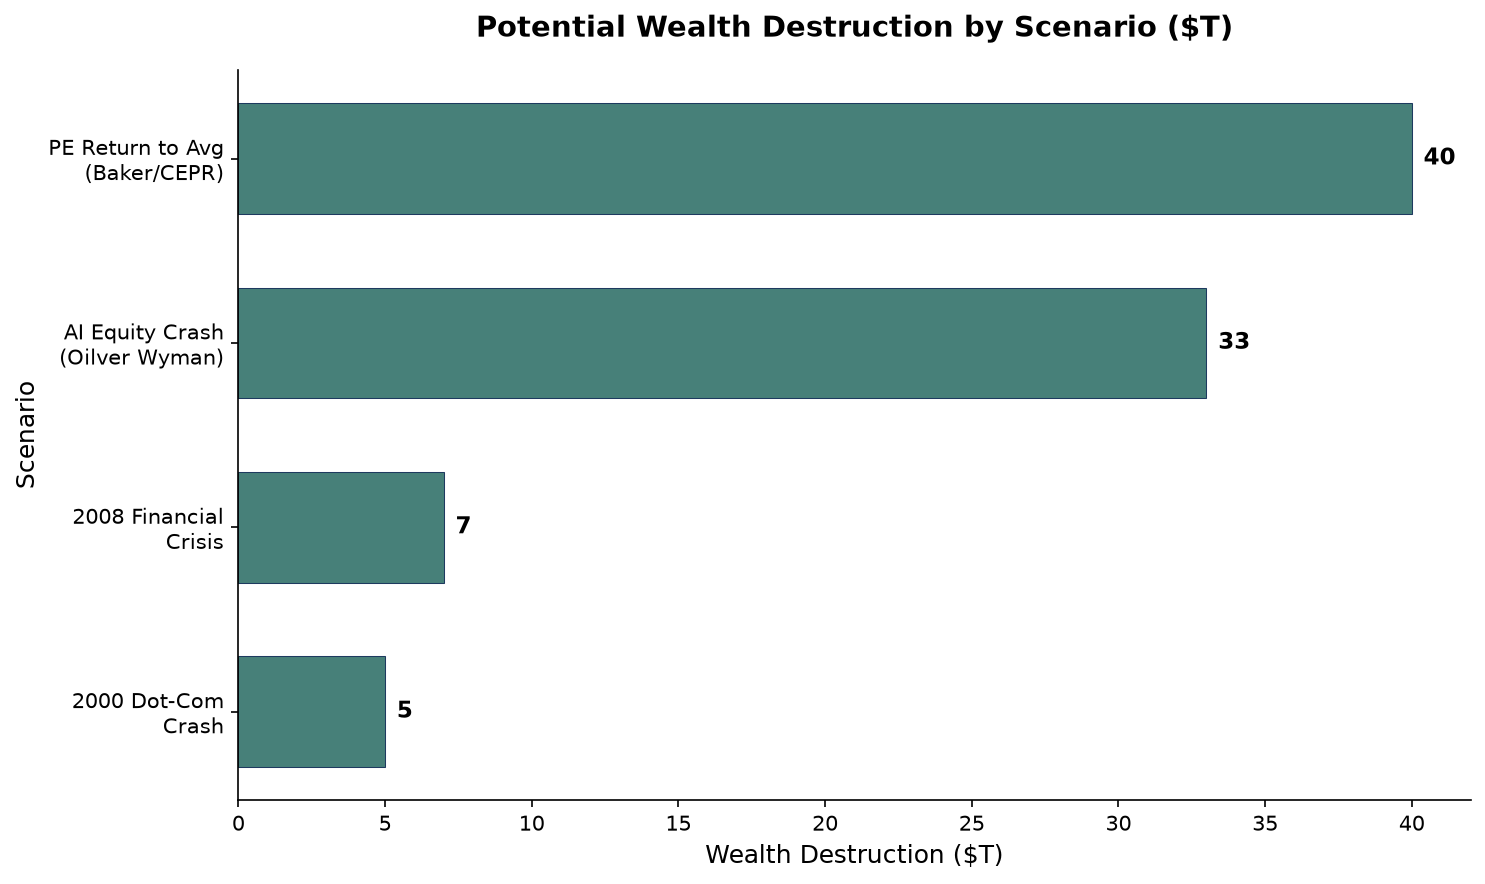
The ratio of total corporate stock value to GDP stands at roughly 2.5, up from about 1.8 at the 2000 peak. In dollar terms, that $80 trillion market represents an extraordinary premium over the productive capacity of the underlying economy. If price-to-earnings ratios simply returned to their long-term average, Baker calculates, the destruction of stock wealth would reach approximately $40 trillion — an average loss of almost $300,000 per American household.
How Does the 2026 AI Bubble Compare to the 2000 Dot-Com Crash?
Historical comparisons are never perfect, but the similarities between 2026 and 2000 are close enough to demand attention. In both cases, a transformative technology drove a sustained equity rally, capital poured into infrastructure at unprecedented rates, and concentration in a handful of stocks reached extreme levels. The differences, however, may make the current situation more dangerous rather than less.
In 2000, the top seven technology stocks accounted for 22-24% of the S&P 500. In 2026, that figure is 34%. In 2000, the CAPE ratio peaked at roughly 44. In 2026, it sits at 39.6 with profit margins at historic highs. Ferrante Capital’s comparison table shows the Mag 7 trading at a forward P/E of roughly 28x, compared to 56x for the 2000 cohort — suggesting today’s multiples are less extreme on an absolute basis. But the weight of these stocks in the index is so much larger that the index-level risk may be greater.
Capital Economics draws a direct parallel in its June 2026 research. The firm notes that recent selloff patterns — sharp reversals after new all-time highs — have previously been seen only during bear markets, including the dot-com crash and the 2008 financial crisis. “The AI rally may be approaching its final stages,” the firm declared, while still predicting a final “blow-off phase” that could push the S&P 500 to 8,250 before a collapse to 6,500 by end of 2027.
One critical difference: in 2000, many of the high-flying companies had no earnings. Today’s AI leaders, particularly the hyperscalers, generate substantial profits and free cash flow. This has led some analysts to argue that the current environment is a “bubble in expectations” rather than a “bubble in valuations.” The distinction matters because profitable companies can survive a downturn — but it does not protect investors from multiple compression. Even if earnings hold up, a 20% compression in the Mag 7’s forward multiple would translate to a roughly 9% decline in the S&P 500, as Ferrante Capital’s scenario math demonstrates.
The bond market offers another warning. Oliver Wyman reports that bond issuance by hyperscalers exceeded $100 billion in the last six months of 2025, more than five times the volume of the prior two years. During the dot-com era, corporate debt issuance also surged before the crash. This time, the scale is larger because the capital requirements are larger: Goldman Sachs estimates cumulative AI infrastructure spending of $7.6 trillion between 2026 and 2031, a figure that rivals the GDP of most developed nations.
What Specific Triggers Could Burst the AI Bubble?
Bubbles rarely burst from a single identifiable cause, and the AI bubble is unlikely to be different. Dean Baker notes that a quarter-century later, economists still cannot pinpoint what exactly caused the 2000 tech collapse — the Nasdaq simply stopped rising and started falling. However, several specific vulnerabilities in the current environment could act as catalysts.
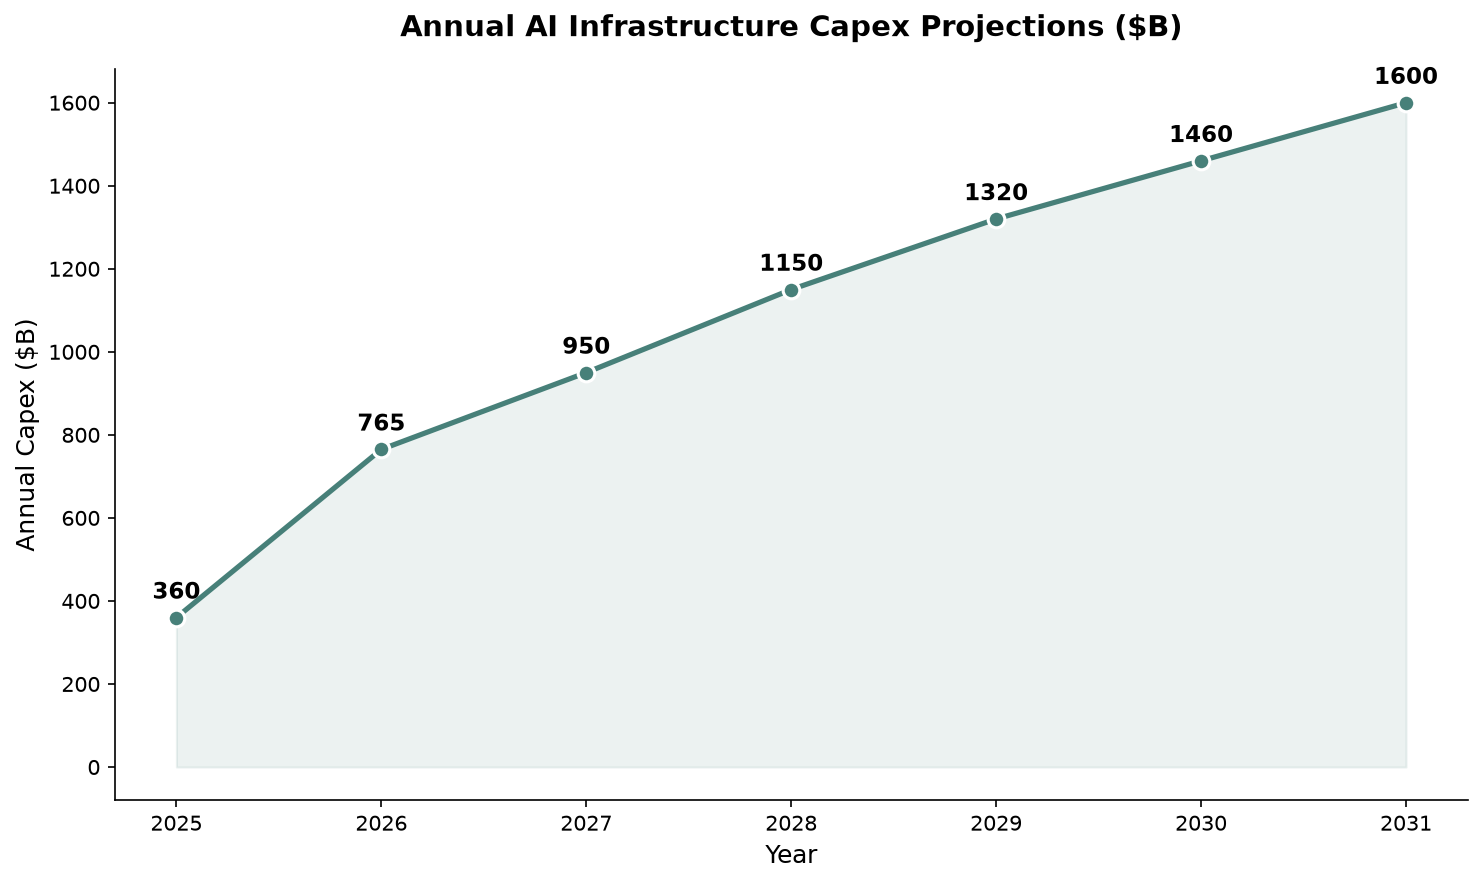
The most widely discussed trigger is a revenue reality check. Goldman Sachs projects $765 billion in annual AI capital expenditure in 2026, growing to $1.6 trillion by 2031. The key question is whether AI-related revenue can grow fast enough to justify this spending. While Nvidia’s data center revenue has grown dramatically, the broader picture is more ambiguous. The four largest hyperscalers — Microsoft, Amazon, Alphabet, and Meta — are spending more on infrastructure than their AI businesses currently generate in revenue. If a single quarter of earnings reveals that ROI is falling short of expectations, the market repricing could be swift.
A second trigger is the rotation out of AI momentum trades. The Nasdaq is already headed for its worst weekly loss in more than a year as of late June 2026, and Capital Economics warns that crowded momentum positioning is at record levels. When momentum reverses, the unwinding tends to be violent because too many investors are positioned in the same direction. This dynamic is amplified by the passive investing revolution: index funds and ETFs automatically allocate roughly a third of new capital to the same seven stocks, creating a self-reinforcing cycle that works in both directions.
A third trigger lies in the debt markets. Oliver Wyman describes a “hybrid scenario” where the AI correction is not confined to equities but is turbocharged by credit. If half of the projected $6 trillion in AI capital spending through 2030 is debt-financed, the credit buildup would exceed all broadband infrastructure investment since the beginning of the internet. Private credit markets are already heavily involved, with more than $1 trillion in AI-related debt expected through alternative lenders. A downturn that triggers defaults in this opaque market could cascade far beyond the tech sector.
Geopolitical risk provides a fourth potential trigger. The US-China technology rivalry, which we examined in our analysis of the US vs China AI race, could disrupt supply chains for advanced semiconductors or lead to export controls that directly impact Nvidia’s revenue. Taiwan’s role in advanced chip manufacturing remains a concentrated geopolitical risk that has no historical parallel in the dot-com era.
What Would a Burst Mean for the Broader Economy?
The wealth effect from equity markets has never been larger. US households held 30% of their total wealth in stocks as of 2024, before the 2025 run-up pushed that figure even higher. A severe market correction would therefore hit consumption directly, which matters because consumer spending drives roughly two-thirds of GDP.
Oliver Wyman outlines two scenarios. In the equity-only scenario, a sudden shift in investor expectations deflates AI-adjacent valuations, triggering a market-wide correction that wipes out approximately $33 trillion in value — more than the entire US economy. This would reduce business investment, particularly in AI-related capital spending that is already driving much of GDP growth, and likely push the economy into recession.
The more dangerous hybrid scenario involves the debt channel. As AI investment shifts from free cash flow to credit, a downturn could trigger widespread defaults. Banks and other lenders may be more exposed than they realize, with risk spread across corporate lending, real estate finance, infrastructure projects, and private credit funds. Oliver Wyman warns that financial institutions “cannot afford to ignore the growing risk” and should prepare for a 30% to 50% equity market fall.
Capital Economics offers a specific timeline. The firm predicts the S&P 500 will reach 8,250 by end of 2026, driven by the final blow-off phase, before collapsing 21% to 6,500 by end of 2027. This trajectory would mirror the pattern seen in previous bubbles: a final surge of irrational exuberance, followed by a multi-year grind lower.
The macroeconomic consequences would extend beyond the US. Global equity markets are tightly correlated with US tech stocks, and the AI build-out is a global phenomenon involving Japanese, Chinese, and European companies. A US-led correction would reverberate through emerging markets that depend on tech exports, and through commodity producers exposed to data center construction demand.
How Will Different Sectors and Jobs Be Affected?
Not all sectors would be affected equally. The direct impact would fall hardest on technology hardware, semiconductor, and data center construction companies. Nvidia, whose market cap has grown more than eightfold since early 2023, represents the most extreme case of valuation expansion tied to AI expectations. A correction that brings its multiple back toward historical levels would represent the single largest wealth destruction event in stock market history.
Cloud computing and enterprise software face a more nuanced picture. These businesses generate real revenue and have diversified customer bases, but their valuations also reflect AI premium pricing. Microsoft, Amazon, and Alphabet each trade at multiples that embed assumptions about AI-driven acceleration in their cloud businesses. If those assumptions unravel, the re-rating would be material but likely less severe than for pure-play AI hardware companies.
The labor market impact could be more lingering than the financial correction. The IMF Staff Discussion Note from January 2026 finds that AI-related skills boost average wages and employment but deepen polarization, mostly benefiting high-skilled workers and — through higher consumption of services — low-skilled workers, while potentially shrinking the middle class. The same research finds that occupations with high exposure and low complementarity to AI experience employment levels roughly 3.6% lower after AI skill entry.
A crash would amplify these trends. Companies would cut costs by accelerating automation in the most easily replaceable roles, while protecting the high-skill workers who drive AI strategy. This pattern was visible after the 2008 crisis, when automation adoption accelerated as firms sought to reduce labor costs. The difference this time is that the technology to replace white-collar knowledge work is more advanced, potentially extending displacement risk to roles that were previously considered safe from automation.
The IMF’s scenario analysis for rapid AI diffusion describes “widespread job displacement pressures,” with task automation displacing routine cognitive and physical jobs in both manufacturing and services. It warns that “social spending pressures rise” as unemployment increases and employment-linked social insurance systems become less effective. In more extreme scenarios, the IMF suggests governments may need to consider universal basic income — a discussion that a severe crash could force into mainstream policy debate.
What Should Investors and Professionals Do to Prepare?
Preparation means different things for different audiences. For individual investors with broad market exposure through index funds, the first step is understanding that a 34% allocation to seven stocks is not diversified by any historical standard. Rebalancing toward value sectors, international equities, and fixed income does not require timing the peak — it simply acknowledges that the current concentration is historically abnormal and unlikely to persist.
For professionals working in AI-adjacent fields, the priority should be building skills that are complementary to AI rather than easily replaced by it. The IMF research is clear: workers in high-exposure, low-complementarity occupations face the most negative outcomes. The safest roles are those where AI augments human judgment rather than replacing it — strategy, cross-functional coordination, client relationships, and domain-specific expertise that training data cannot easily capture.
For companies investing in AI infrastructure, the message from Oliver Wyman and others is to stress-test assumptions. The current capex plans assume continuous growth in AI demand. A recession would reduce enterprise technology spending, lengthen sales cycles, and push ROI timelines further out. Companies that build flexibility into their AI investment plans — opting for shorter lease terms, avoiding vendor lock-in, and maintaining the ability to scale down — will be better positioned than those that commit to multi-year capacity contracts at peak pricing.
Oliver Wyman’s advice to financial institutions applies more broadly: “Firms that act early to execute hedges and diversify portfolios will be best positioned to weather the storm.” For individual investors, that means taking profits incrementally rather than trying to time the exact top. For professionals, it means developing portable skills and maintaining a network that transcends any single employer or industry. For everyone, Dean Baker’s weekly AI Bubble Monitor offers a sobering reminder: a PE ratio of 39.6 does not guarantee a crash tomorrow, but it has never been sustained indefinitely in the history of modern markets.
The most practical preparation may be the simplest: diversify, reduce leverage, and maintain a time horizon that extends beyond the current cycle. Bubbles are only obvious in retrospect, but the data available in June 2026 makes the case that one exists. Acting on that evidence before the market confirms it is the difference between being prepared and being caught off guard.